Phase 2 garden soil readings and the Health Cell's kidney cancer count for one neighbourhood, on one map
One map puts the Phase 2 garden PFOA readings, the Phase 3 report's stated directions of highest readings, and the neighbourhood where Lancashire's Health Cell counted 14 kidney cancers against about 6 expected on the same ground. It shows where two sets of published figures overlap. It does not show a cause, and the Health Cell concluded there is no evidence of a statistically significant kidney cancer cluster.
- WSP for the Environment Agency, Phase 3 residential soils investigation, factual report, March 2026 (Wyre Council): Table 4-1 (PDF p.31), Insert 4-1 and the orientation text (PDF p.32), Appendix J, Phase 2 tables for residential properties.
- WSP for the Environment Agency, Phase 2 factual report, July 2025 (Wyre Council): trial pit logs with grid references.
- Document headed ‘AGC Chemicals Europe Ltd – Legacy Contamination Inspection, June 2025 Update’ (published with the Phase 2 results; its text does not name its author): 7.6 µg/kg screening threshold for gardens where vegetables are grown.
- Lancashire Health Cell, Assessment of Kidney Cancer Patterns, v1.0, last review 12 May 2026 (Wyre Council, https://www.wyre.gov.uk/downloads/file/2464/final-report-assessmentkidneycancerpatterns-approved): PDF pp.6, 8, 9, 10, 11, 12.
- Office for National Statistics, LSOA (December 2021) boundaries, Open Government Licence. OpenStreetMap contributors (ODbL).
Co-location is not cause. This map puts two sets of published figures on the same ground. It does not show that soil contamination caused any cancer. The Lancashire Health Cell, which assessed kidney cancer in this area, concluded “there is no evidence of a statistically significant kidney cancer cluster” (Health Cell report, PDF p.12). The limits of the map are set out in full below.
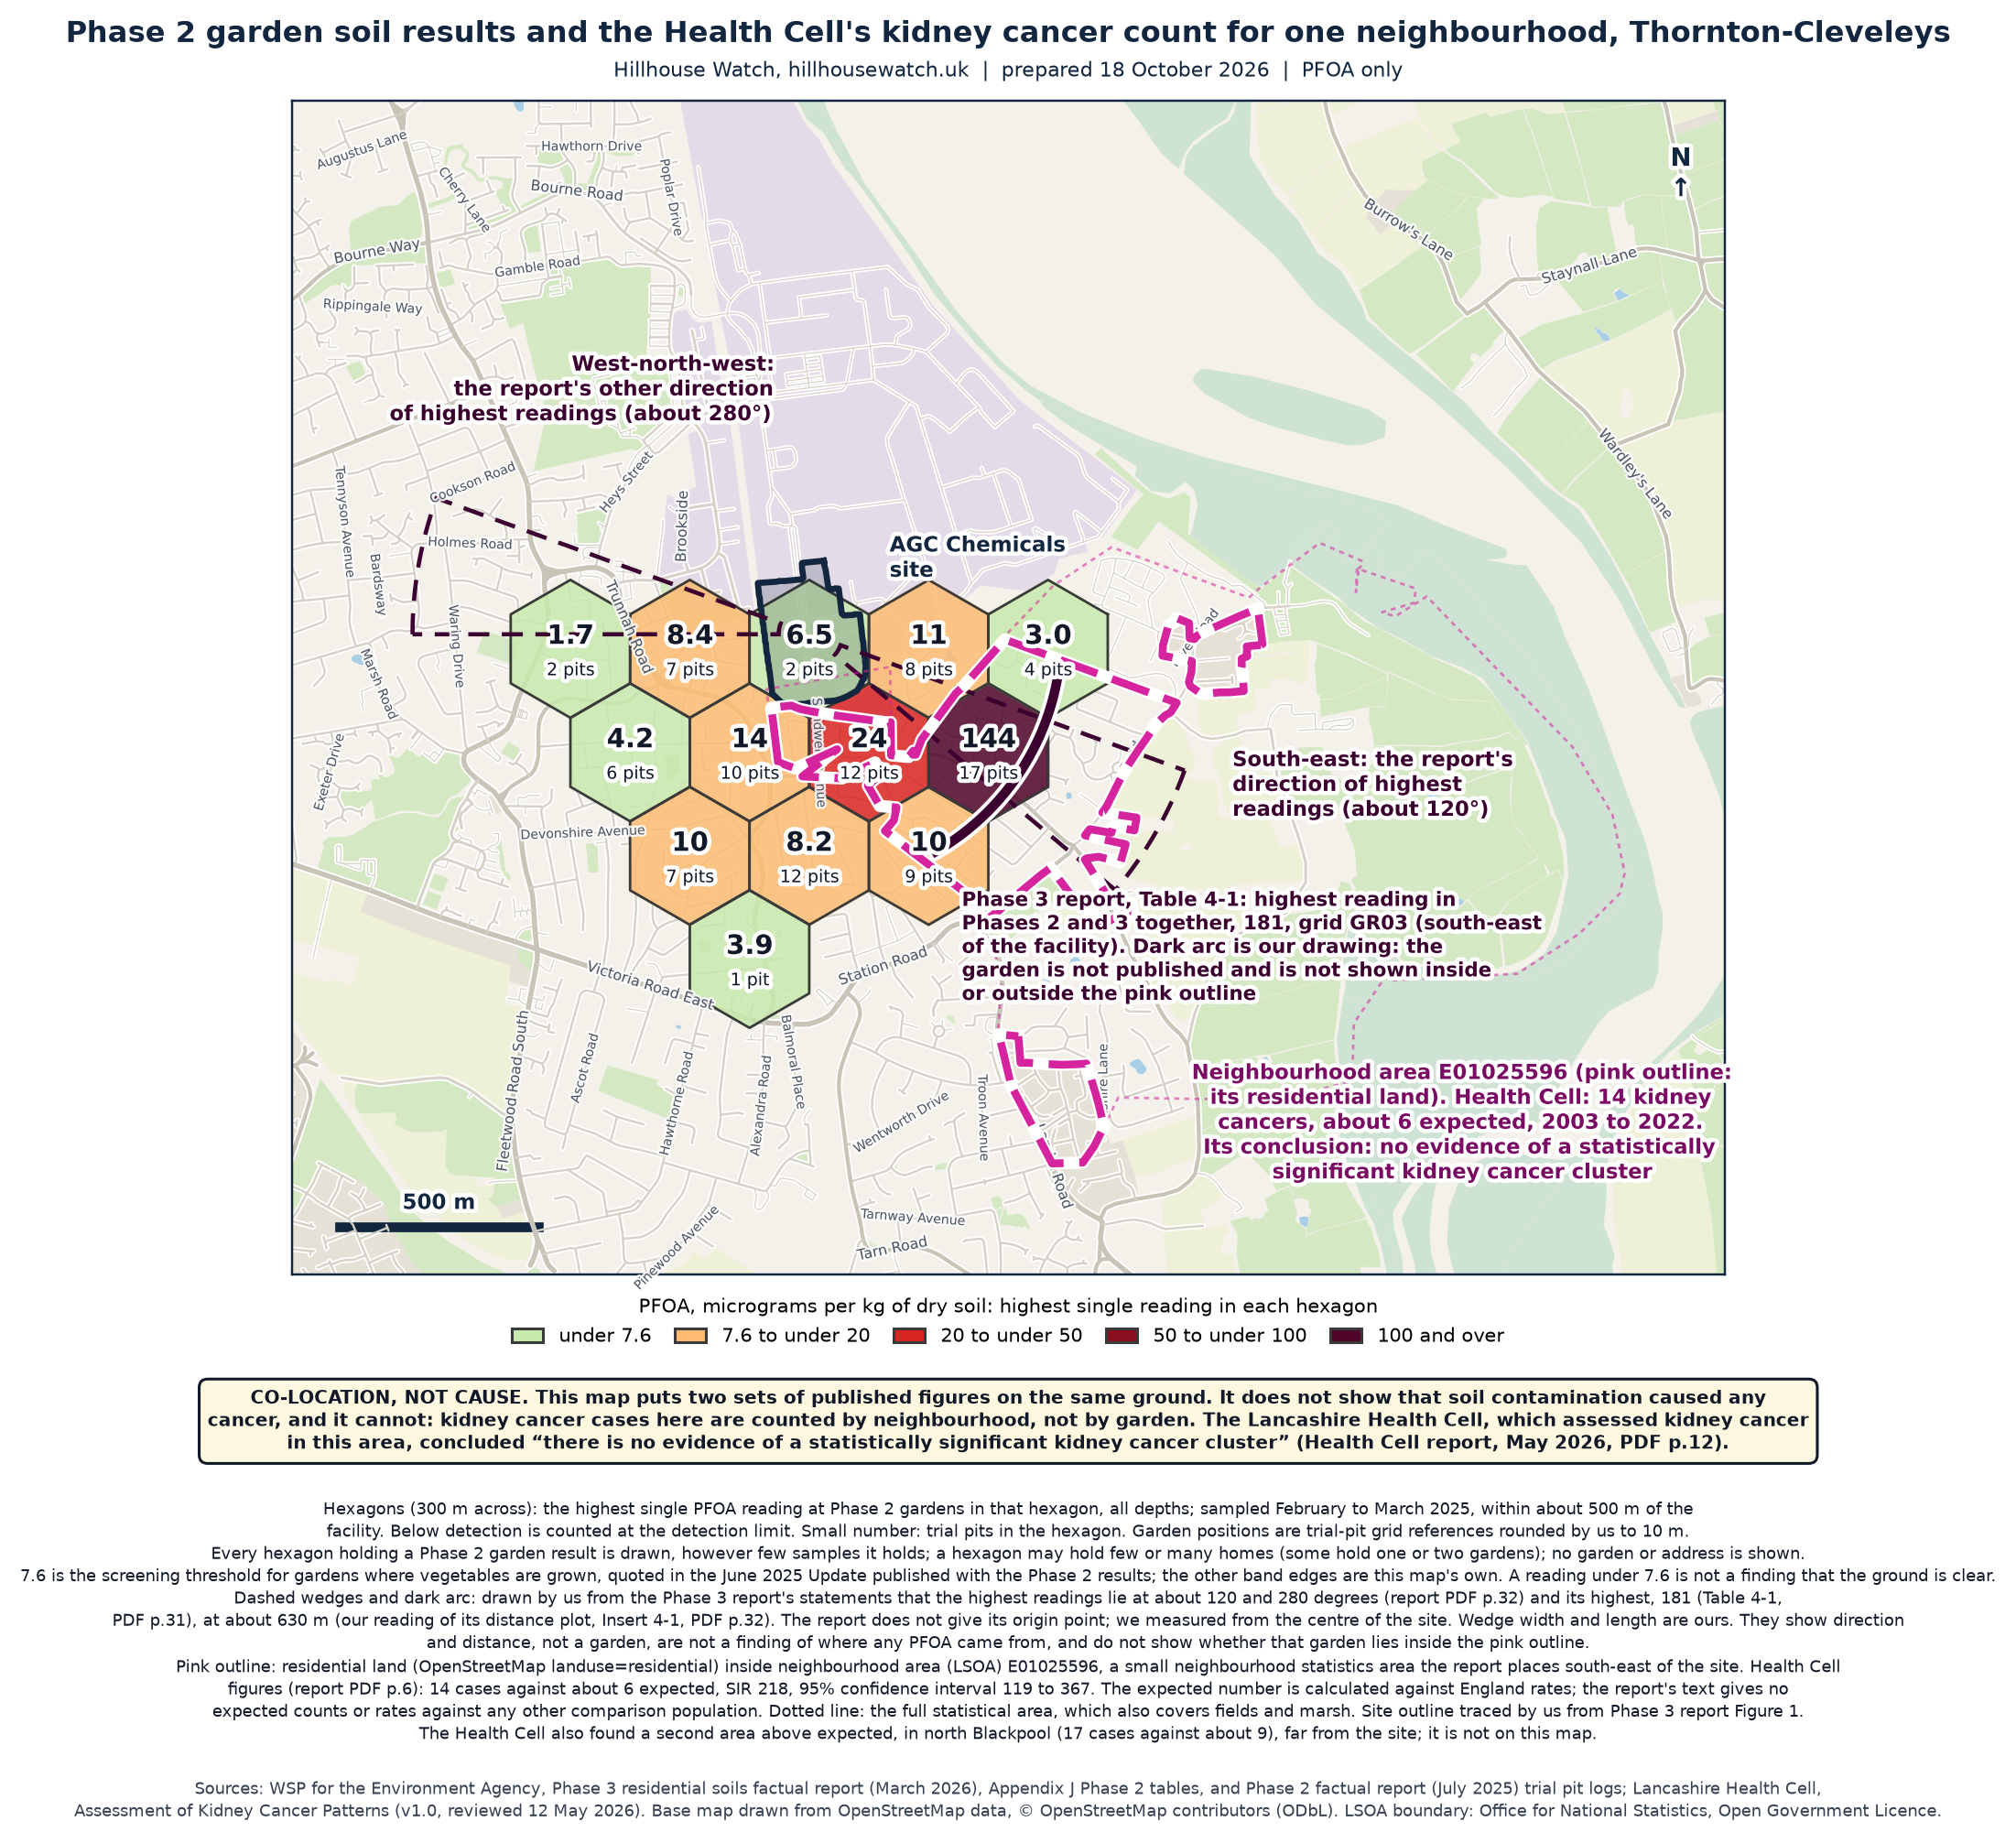
The map as published. Figures and sources are on the image itself and repeated below. Prepared 18 October 2026.
What the map shows
- Garden soil readings. Phase 2 sampled garden soil within about 500 m of the facility (the reports’ own basis) in February and March 2025. Each 300 m hexagon shows the highest single PFOA reading (perfluorooctanoic acid, the substance under investigation) at Phase 2 gardens in that hexagon, at any depth, in micrograms per kilogram of dry soil. The small number is how many trial pits it holds. The data are 217 garden samples at 97 trial-pit positions: 208 printed in Appendix J of the Phase 3 report, and 9 more read from the Phase 2 laboratory certificate. Every hexagon that holds a Phase 2 garden result is drawn, however few results it holds. The highest reading in any hexagon is 144, which matches the maximum the Phase 3 report’s Table 4-1 gives for grid GR01, the Phase 2 gardens south and south-east of the site (PDF p.31).
- Directions of highest readings. The Phase 3 report says that, across its combined Phase 2 and 3 data, “the highest concentrations are c. 120˚ (south-east) and 280˚ (west-north-west)” (PDF p.32). The dashed wedges are ours, drawn from those two bearings. The dark arc marks the report’s highest single reading, 181, at about 630 m from the site, south-east. The 630 m is our reading of the report’s distance plot (Insert 4-1, PDF p.32), not a figure it prints. The report does not state what point it measured from, so we used the centre of the site. The wedges and the arc show a direction and a distance. They are not a finding of where any PFOA came from, and this map does not show that it came from the AGC site or from anyone else. They do not locate any garden, and they do not show whether the garden with the 181 reading is inside or outside the pink outline.
- The neighbourhood with the kidney cancer count. The Health Cell reported that neighbourhood area E01025596, which it describes as “located south-east of the site”, had 14 kidney cancer cases in 2003 to 2022 where “six” were expected; a standardised incidence ratio of 218, with a 95% confidence interval of 119 to 367 (PDF p.6). The Health Cell also reported a second area above expected, in north Blackpool (17 cases against nine expected, SIR 181, 95% confidence interval 106 to 290), far from the site; it is not on this map. A neighbourhood area of this kind (an LSOA, Lower-layer Super Output Area) is a small statistical area defined by the Office for National Statistics. The dotted line is the full area; the pink outline is only its residential land, taken from OpenStreetMap land-use data and clipped by us.
- How much of the Phase 2 data lies inside. 94 of the 208 Phase 2 garden samples printed in Appendix J (41 of the 97 positions) fall inside the neighbourhood area, about 45%; the same 94 lie in its residential land (the pink outline). Phase 2 sampling was chosen by the Environment Agency and its contractor, so this share describes where samples were taken, not where contamination is. Positions are rounded to 10 m and the boundary is generalised, so the count could be a few either way; moving the boundary by 10 m gives between 83 and 102 of the 217 samples (counting the 9 certificate-only samples as well). The highest Phase 2 reading, 144, lies inside it. The Health Cell says environmental datasets “cannot be used to infer exposure levels for individual cases” (PDF p.11).
What the Health Cell concluded
These are the Health Cell’s statements, not ours:
- It found that “the rate in LSOA E01025596 was similar to those in other LSOAs, although it was higher than the England average” (PDF p.12).
- It reported “no clustering of cases close to the AGC CE site, no pattern of decreasing incidence with distance, and no alignment with expected environmental air dispersion or soil contamination data” (PDF p.12).
- It concluded “there is no evidence of a statistically significant kidney cancer cluster” and “the Health Cell agreed that no further cluster investigation is warranted at this stage” (PDF p.12).
What this map does not show
- Not causation. The map cannot show that PFOA in soil, or anything from the site, caused any cancer, or that it did not. Overlap of two sets of figures on a map is not evidence of a link. The Health Cell described its findings as “consistent with the level of random variation expected when undertaking multiple small analyses and multiple statistical comparisons” (PDF p.10).
- Neighbourhood counts, not gardens. Kidney cancer cases are counted by the neighbourhood where a person lived at diagnosis. The Health Cell lists “use of residence at diagnosis as a proxy for exposure” among its limitations (PDF p.11). Nothing here links any person with any garden, and the map shows neither.
- Different years. The cancers were diagnosed over 2003 to 2022. The soil was sampled in 2025. A soil reading does not tell us what was in the ground, or the air, in earlier years.
- Phase 3 is not on the map by value. Phase 3 took 1,126 garden samples at 71 properties, including the 181 reading. The report prints no sample coordinates, so none of them can be placed. The Phase 2 gardens drawn here are those with published results. A hexagon with no plotted result has no mapped Phase 2 garden result here, and a low hexagon value describes only the samples taken in it. Neither shows that ground that was not sampled is clear.
- The Health Cell’s comparison. The “about 6” expected cases is calculated against England-wide rates. The report says consideration “was given to comparator populations beyond national rates, including wider local and regional populations” (PDF p.8). Its text gives no expected counts or rates against any of them. Its Technical Appendix 2 (PDF p.14) compares the tumour characteristics of the 14 cases (age, sex, type) with the 498 kidney tumours in Wyre, Fylde and Blackpool, and the plots in its Appendix 4 (PDF p.22) name comparison groups but print no values.
- The Health Cell’s use of soil data. The report says soil data from the ongoing inspection “were used descriptively, together with maps showing the geographic distribution of kidney cancer cases”, as a “visual comparison” that “does not provide evidence of a causal link between soil contamination and cancer incidence” (PDF p.8). It says its environmental data are “limited in [their] ability to characterise historical exposures” and were “used descriptively rather than analytically” (PDF p.11). It does not say which soil results were used or how many. We read its Environmental Information, Results, Limitations and Conclusion sections and its appendices.
- Rounding and approximation. Garden positions are trial-pit grid references rounded by us to 10 m, with an allowance of about 15 m. The site outline is traced by us from Figure 1 of the Phase 3 report. The hexagon figure is the highest single reading, not an average, and a hexagon may hold few or many homes, and some hold only one or two gardens.
- 7.6 and the other band edges. 7.6 µg/kg is the screening threshold for gardens where vegetables are grown, quoted in the June 2025 Update published with the Phase 2 results. The other band edges are this map’s own. A reading under 7.6 is not a finding that the ground is clear, and a reading over it is not a finding of harm. Only PFOA is mapped; the Phase 3 report says 50 PFAS were analysed, PFOA among them.
- Privacy. No garden, house or address is shown. The base map, drawn from OpenStreetMap data, shows roads with their published street names and land-use areas, with no building outlines or house points.
What would answer the questions this map raises
- From the Health Cell: the comparison populations it used for the 14 against about 6, with the rates and counts for each, and the values behind the plots in its Appendix 4. We have asked Lancashire County Council for the figures by Freedom of Information request; a reply is due by 26 October 2026 (Open questions). We will publish the answer either way.
- From the Environment Agency and WSP: the Phase 3 sample coordinates, or the Figure 2 map of each property’s average, which is blacked out in the published report. We will publish what comes back in a form that does not identify anyone’s home.
Sources
- WSP for the Environment Agency, Phase 3 residential soils investigation, factual report, March 2026, published by Wyre Council: wyre.gov.uk/downloads/file/2452/phase-3-factual-report. PDF pages as cited above.
- WSP for the Environment Agency, Phase 2 factual report, July 2025, published by Wyre Council.
- Lancashire Health Cell, Assessment of Kidney Cancer Patterns, v1.0, last review 12 May 2026, published by Wyre Council. PDF pages as cited above.
- Document headed “AGC Chemicals Europe Ltd – Legacy Contamination Inspection, June 2025 Update”, published with the Phase 2 results; its text does not name its author.
- Office for National Statistics, LSOA (December 2021) boundaries, Open Government Licence. Map data © OpenStreetMap contributors, Open Database Licence.
Related: Kidney Cancer South-East of Hillhouse: 14 Cases Where 6 Were Expected. What the Health Cell’s Assessment Did and Did Not Measure., Lancashire County Council’s Kidney Cancer Assessment: A Statistically Significant Excess Against England’s Rates, and the Questions It Leaves, Phase 3 Soil Results: What They Show, and What They Do Not Explain. Who runs this site, and its relationship with Leigh Day: About.