Kidney Cancer South-East of Hillhouse: 14 Cases Where 6 Were Expected. What the Health Cell's Assessment Did and Did Not Measure.
The Lancashire County Council Health Cell's kidney-cancer assessment (v1.0 Final, last reviewed 12 May 2026) records 14 cases where 6 were expected on England's rates, over 2003 to 2022, in one small area south-east of the Hillhouse site: a standardised incidence ratio of 218 (95% confidence interval 119 to 367), from analyses provided by the National Disease Registration Service, which the Health Cell deemed statistically significant. Compared with other small areas, the report says, the rate there was statistically similar to most. It reports no gradient of risk with proximity to the site, no alignment with soil or air-dispersion data, geographically dispersed cases and no similarities in tumour characteristics suggesting a common cause, and concludes there was 'no evidence of a kidney cancer cluster' and that the variation was 'consistent with normal statistical fluctuation'. It did not measure anyone's exposure, does not seek to establish causality, and describes its comparison with the soil data as 'for contextual understanding only'. Within 1 km, WSP's garden soil results show no clear correlation between concentration and distance either.
From the Lancashire County Council Health Cell’s kidney-cancer report on the Hillhouse area.
From the Health Cell’s kidney-cancer assessment and WSP’s soil reports for the Environment Agency. All are public; figures and sources are given so you can check them.
The US National Cancer Institute defines a cancer cluster as “the occurrence of a greater than expected number of cancer cases among a group of people in a defined geographic area over a specific time period”, and says in the same fact sheet that “clusters of cancer can arise by chance” (NCI). By that definition, which is the NCI’s and not the report’s, the numbers for one small area south-east of the Hillhouse site fit it when compared with England’s rates: 14 cases observed against 6 expected. The report, applying UK Health Security Agency guidance, concluded that there was no evidence of a kidney cancer cluster. Both are set out below.
Who produced the report
The assessment was carried out by the Lancashire County Council Health Cell, a multi-agency group convened by Lancashire County Council’s Director of Public Health. The report lists the Health Cell’s membership as Lancashire County Council, Wyre Borough Council, the Environment Agency, the UK Health Security Agency, NHS Lancashire and South Cumbria ICB and the National Disease Registration Service (NDRS), and names LCC Public Health as the document owner. The case counts and standardised incidence ratios are NDRS’s: the report calls them “the analyses provided by NDRS (case counts and SIRs)”. Its cover gives version 1.0 Final and a last-review date of 12 May 2026. Wyre Council publishes it.
What the report found
In a small area south-east of the site (LSOA E01025596), which the report describes as close to the site, it records 14 kidney cancer cases over 2003 to 2022 where six were expected on national (England) rates: a standardised incidence ratio of 218, with a 95% confidence interval of 119 to 367. The report’s rule is that “If the range stays entirely above or below 100, the difference is considered meaningful.” This range stays above 100, so against England the excess in that one area is statistically significant; the report says the two areas with an excess “were deemed to be statistically significant by the Health Cell”. The second is LSOA E01012665 in the north of Blackpool: 17 cases where nine were expected (SIR 181, 95% confidence interval 106 to 290).
Against other small areas, the report gives a different result: “When age-standardised rates were compared with England and other LSOAs, the rate in LSOA E01025596 was statistically similar to those in most other LSOAs, although it was higher than the England average.” It says it also considered “comparator populations beyond national rates, including wider local and regional populations with similar demographic characteristics”. Technical Appendix 2 compares the 14 cases in E01025596 with the 498 kidney tumours recorded in the 79 small areas across Wyre, Fylde and Blackpool that were listed to NDRS, by sex, age, tumour type, grade and stage. Technical Appendix 4 gives “SIR over time faceted by comparison group plots”: charts of the ratio over four five-year periods, 2003 to 2022, for three distance bands around the site, against England, the North West region, Wyre (Fylde, Blackpool and Wyre together for the widest band) and a group the charts label “lanc_sampled_lsoas”. The report gives these comparisons as statements and charts; it does not give the comparator rates, or the ratios calculated against them, as figures.
These are the report’s figures; the tables behind them are not in the report and we have asked for them.
What it set out to test, and what it concluded
The report gives its second stage two purposes: “whether the observed excess of kidney cancer cases existed during 2003-2022 and when compared with alternative comparators”, and “whether the observed pattern could, in principle, be linked to a plausible environmental exposure pathway, considering biological plausibility and known limitations of the available data.”
It took kidney cancer forward to that stage “given the international evidence base linking PFOA exposure to kidney cancer”. Its findings, in its own words:
- “there were no consistent spatial or temporal patterns identified, and there was no evidence of an increasing gradient of risk in relation to proximity to the site”
- “there was no clustering of cases close to the current AGCCE site, no pattern of decreasing incidence with distance, and no alignment with expected environmental air dispersion or soil contamination data”
- cases “were geographically dispersed, with no aggregation suggestive of a localised cancer cluster”
- “A contextual comparison with available environmental datasets did not identify any spatial alignment between the distribution of cancer cases and the levels found in soil from the on-going inspection”
- the review of tumour records “did not identify similarities in tumour morphology or characteristics suggestive of a common aetiology, with cases displaying heterogeneity consistent with background incidence”
- “the findings were considered consistent with the level of random variation expected when undertaking multiple small analyses and multiple statistical comparisons for cancers with relatively low annual case numbers”
It concluded “that there was no evidence of a kidney cancer cluster, no indication of an environmental association, and that further cluster inspection was not required”, and that, taking its limitations into account, “the observed variation in kidney cancer incidence is consistent with normal statistical fluctuation.”
What the report did not measure
The report states its own limits. “The assessment did not include direct measures of individual exposure to PFAS or other environmental contaminants.” Soil sampling data “were used descriptively”, and the comparison with maps of the cases “was undertaken for contextual understanding only and does not provide evidence of a causal link between soil contamination and cancer incidence”. Cases are recorded by “place of residence at diagnosis, not residence at the time of potential exposure”. And the assessment “does not constitute a formal human health risk assessment, nor does it seek to establish causality.”
The report maps the cancer ratio for each small area (Technical Appendix 1) but does not show where within an area the cases were: maps of their postcode locations “cannot be presented in this report as they are potentially individual identifiable”. Its comparison of case locations with the soil data therefore cannot be repeated from the published documents.
The distance finding and the soil pattern
One of the report’s findings is that kidney cancer risk did not rise with proximity to the site and incidence did not fall with distance. WSP’s soil results for the Environment Agency show the same absence in the soil. WSP’s Phase 2 and 3 garden results, which lie within 1 km, show no clear correlation between concentration and distance (WSP Phase 3 report, March 2026). WSP’s Phase 3 report records the highest concentrations at “c. 120° (south-east) and 280° (west-north-west) rotation”, so there are two peaks, not one. The highest reading, 181 micrograms per kilo, is to the south-east, about 630 metres from the facility on WSP’s distance plot, higher than the 144 micrograms per kilo that Phase 2 found at its maximum sampling radius of 500 metres. The lowest group maximum, 10.1 micrograms per kilo, was in WSP’s zone to the south-west and west within 500 metres. Within the area WSP sampled in Phases 2 and 3, the pattern runs by direction rather than by distance.
The south-eastern of the two small areas with an excess against England lies in that same direction: by our measurement from WSP’s own map, about 90% of the area WSP treated as “potential higher deposition” lies inside it.
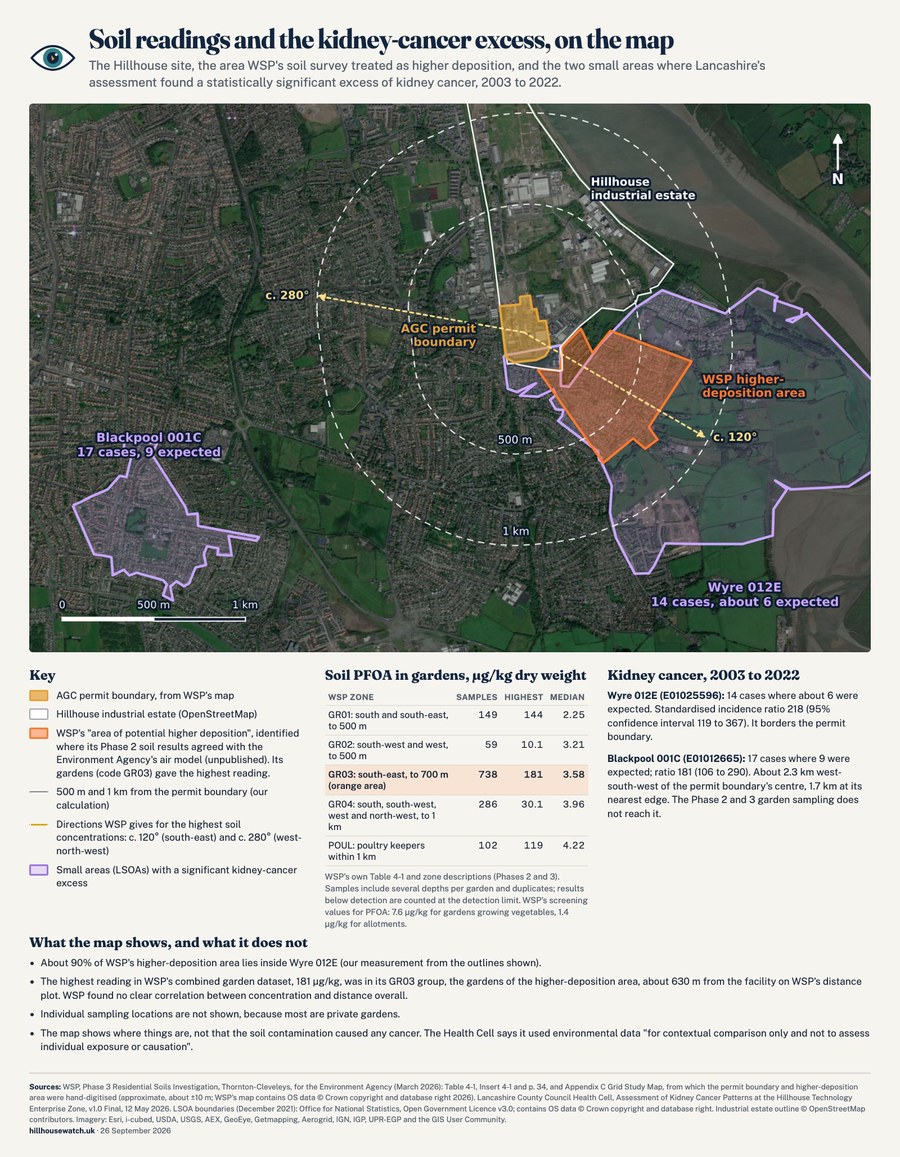
Corrected 26 September 2026: this post previously used a schematic map. In the smaller versions shown on some screens, its legend still gave a “Dutch screening value” of 3.8 µg/kg, a figure withdrawn from this site because it could not be sourced; it placed the highest soil reading at 700 m, where WSP’s own distance plot puts it at about 630 m; it said the peak “rises from 500m to 700m”, which WSP’s report does not support (it finds no clear correlation between concentration and distance); and its caption here said the readings rise with distance. The map is now drawn on satellite imagery, from WSP’s own georeferenced map and the official boundaries of the two small areas. The text above is corrected to match.
Our reading, not the report’s: within 1 km the soil itself shows no clear correlation between concentration and distance, so the absence of a distance gradient in the cancer figures does not, on its own, count against a link with the soil. The report did not rest on distance alone. It also reports no alignment with the soil and air-dispersion data, dispersed cases, no similarities in tumour characteristics suggesting a common cause and the chance findings expected from many small comparisons, and it found the rate in E01025596 statistically similar to most other small areas. The case locations that would let anyone repeat its alignment finding are not published.
We are not saying the site caused these cancers
We are not. This proves nothing about any individual case, and we make no such claim.
What we are saying is narrower. Against England’s rates, the excess in one small area south-east of the site is statistically significant, and the Health Cell says so. The report did not measure anyone’s exposure and does not seek to establish causality. And one of its findings, that risk does not fall with distance, is shared by the soil within the area WSP sampled in Phases 2 and 3, where PFOA levels show no clear correlation with distance.
What we are asking
Two things would let anyone compare the cancer figures with the soil results area by area: the full table of cancer figures for each small area, which the report says came from “the analyses provided by NDRS”, and the map coordinates of the soil samples from the Environment Agency’s inspection. Neither would show where within an area the cases were; the report withholds the postcode locations because an individual’s postcode counts, in its words, as “personally identifiable information”. We are asking for both, openly, and will publish what comes back in a form that does not identify anyone’s home.
How we know: the excess, the confidence interval, the comparison with other small areas, the findings and the “no cluster” conclusion are in the Health Cell’s “Assessment of Kidney Cancer Patterns at the Hillhouse Technology Enterprise Zone, Thornton-Cleveleys”, v1.0 Final, last reviewed 12 May 2026, published by Wyre Council; the soil readings and their directions are in the WSP Phase 2 and Phase 3 reports for the Environment Agency, published by Wyre Council. The cluster definition is the US National Cancer Institute’s fact sheet on cancer clusters. On PFOA and kidney cancer: the C8 Science Panel (2012) found a “probable link”; IARC (2023) classified PFOA in Group 1, “carcinogenic to humans”, on sufficient evidence in experimental animals and strong mechanistic evidence in exposed humans, with limited evidence in humans for kidney and testicular cancer; and the US EPA (2024) classified PFOA as “Likely to Be Carcinogenic to Humans” (the science, body by body). The map is drawn on satellite imagery: the permit boundary and higher-deposition area are digitised from WSP’s georeferenced Grid Study Map (approximate, about ±10 m), and the two small areas are the official ONS boundaries. Individual soil sampling locations are not shown, because most are private gardens.
Status, 28 September 2026: we have asked Lancashire County Council, by Freedom of Information request, for the figures behind this assessment: observed and expected cases, standardised incidence ratios and confidence intervals for every area and every cancer screened, and the comparison populations used in the report’s second stage, with the rates and ratios calculated against them, which the report gives as statements and charts but not as figures. A reply is due by 26 October 2026. Open questions